If you’re like most developers, when you’re working with unfamiliar code or even actively developing, you may find yourself writing man print statements and rerunning your program. While this is quick to write, it becomes less effective the more times you loop over this process. Additionally, you have to add all your printouts up front and can’t immediately leverage newly gained knowledge to add additional output. This can especially be a pain when your program can take a while to get to the print outs, say when running large processing tasks or performing machine learning.
Most developers know that at some point you should pull out a debugger but I’ve seen most, including myself, continue to push the print and run methodology way to far. Especially when running remotely.
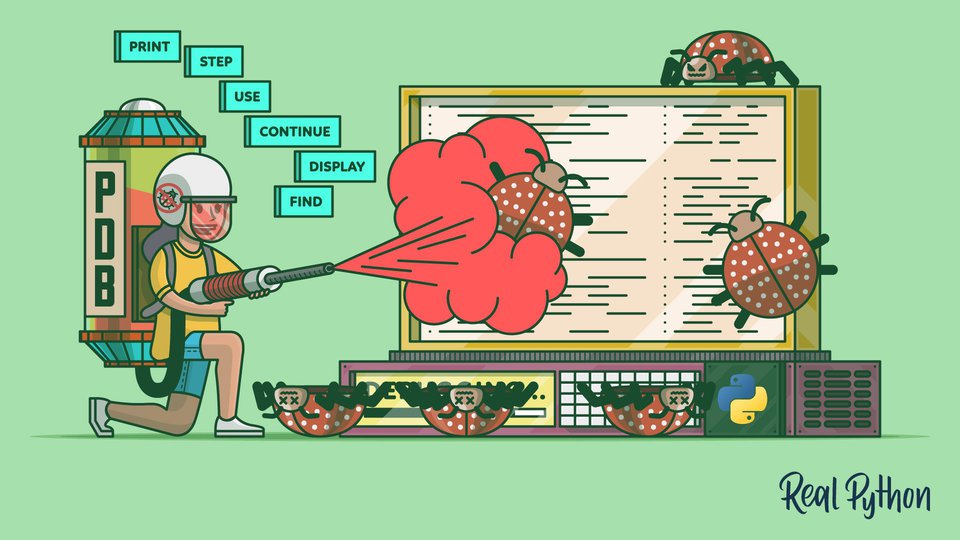
Well I’m writing this today to show you how easy it is to use the python debugger. This little information may be paying you dividends daily, as I know I leverage this constantly during my day-to-day work.
It’s now even easier to set a breakpoint. Introduced by PEP 553, one can simple write breakpoint() in their program and when that line is hit, you’ll be dropped into a pdb environment. Note that this does not even require an import!
In the pdb session, you can print out all the variables you want and even execute arbitrary code. Which makes ones debugging time way more useful. I’d recommend reading how to use pdb, like the official documentation, to learn how to get the most out of the program.
One additional tip I’d recommend is installing pdbpp, which is a drop in replacement for pdb. There are many features that this package provides, but my favorite and most used is just tab complete.
So there you have it, a quick and easy way to drop into a debug session by modifying your code. Say goodbye to writing print outs and hello to leveraging debuggers!